|
Index menu presents relevant data of local stock indices including VN Index, HASTC Index and UPCOM Index to help you monitor market movements.
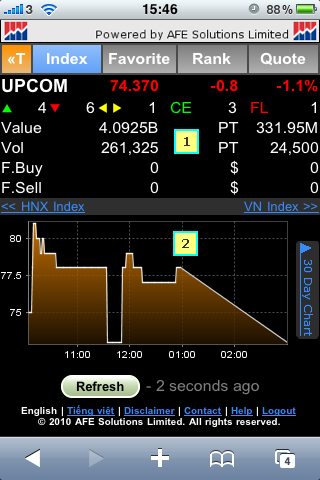
 Info Data Info Data
| Field |
Description |
| Last |
Last index point |
| Change |
Compare Last price with Previous Close |
| %Change |
Displayed in bracket |
| Value |
Accumulated trading value in Vietnam Dong
B stands for Billion Vietnam Dong
M stands for Million Vietnam Dong
K stands for Thousand Vietnam Dong |
| PT Value |
Accumulated Put Through trading value in Vietnam Dong |
| Volume |
Accumulated trading volume |
| PT Volume |
Accumulated Put Through trading volume |
| Session |
Session 1 stands for Pre-open
Session 2 stands for Open
Session 3 stands for Pre-close
Session PT stands for Close
Closed stands for Market Closed |
 |
Number of stock with positive change in price |
 |
Number of stock with negative change in price |
 |
Number of stock with zero change in price |
| CE |
Number of stock trade at ceiling price |
| FL |
Number of stock trade at floor price |
| F. Buy |
Foreign buy volume |
| F. Buy ($) |
Foreign buy value. Not show in VN Index |
| F. Sell |
Foreign sell volume. Not show in VN Index |
| F. Sell ($) |
Foreign sell value. Not show in VN Index |
Click on UPCOM Index >> or HNX Index >> or VN Index >> link to switch between indicies.
 Chart Chart
There are 2 chart modes: 1 Day Tick Chart and 30 Days Daily Chart.
1 Day Tick Chart - tick chart of current instrument.
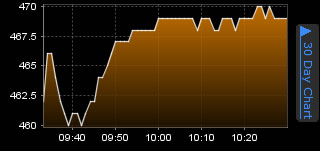
Click on 30 Days Daily Chart >> link to display 30 Days Daily Chart.
30 Days Daily Chart - 30 day candlestick daily chart of current instrument (include today data).
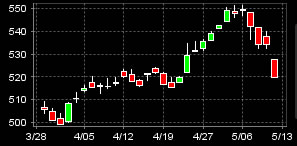
Click on 1 Day Tick Chart>> link to display 1 Day Tick Chart .
Back to top
|