|
Button
|
|
|

|
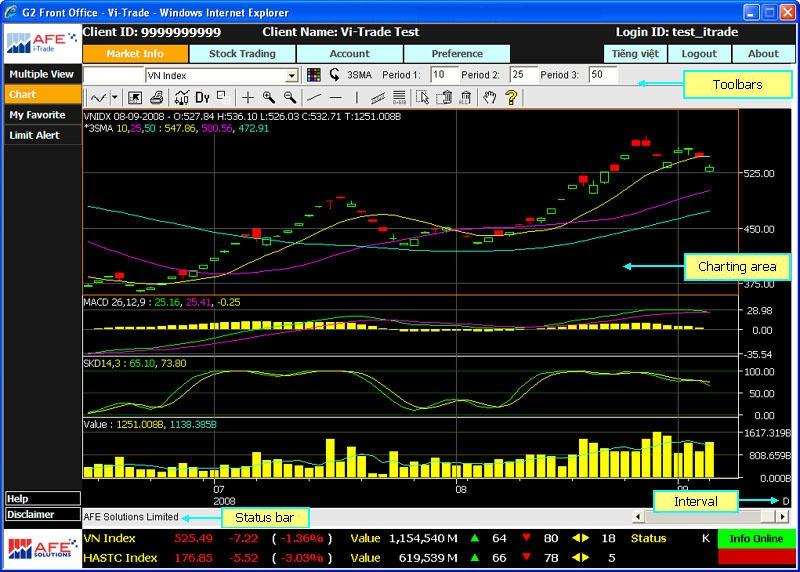
Command Line. Input instrument symbol and press Enter.
|
|
|
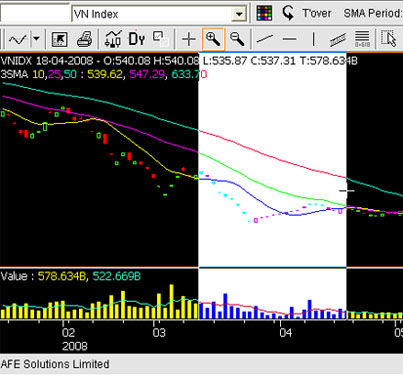
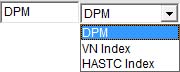
Indices List. A drop down list for all available indices. User can chart indices quickly without enter the code. At top of the indices list, a history of latest 10 requested instruments entered via the Command Line will be kept.
|
|

|
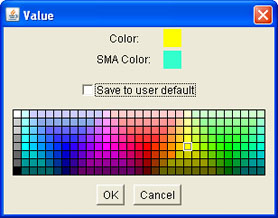
Color Palette. Click this button to change color of the current Technical Analysis.
|
|
|
|
|
|
To change color, user simply click on the color button of the appropriate indicator, then select the color from the color palette. Click OK button to activate the change. The change will only apply to the current analysis. If user want the save it as default, check Save to user default option.
|
|

|
Recalculate. Click this button to recalculate Technical Analysis value after changed Parameters (Period).
|
|
|
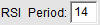
TA Parameters. Parameters command of the current technical study. These parameters are specified at the time the indicator is plotted.
|
|
|
|
|
|
To change parameter of Technical Analysis, click on the Technical Analysis (TA) legend in the TA. The TA will be highlighted with an asterisk on the left. The asterisk indicates that is the current TA being selected. The TA Settings will have its parameters displayed accordingly.
|
|

|
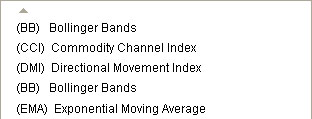
Add Technical Analysis. Click this button displays a drop down menu containing the studies you can add.
|
|
|
|
|
|
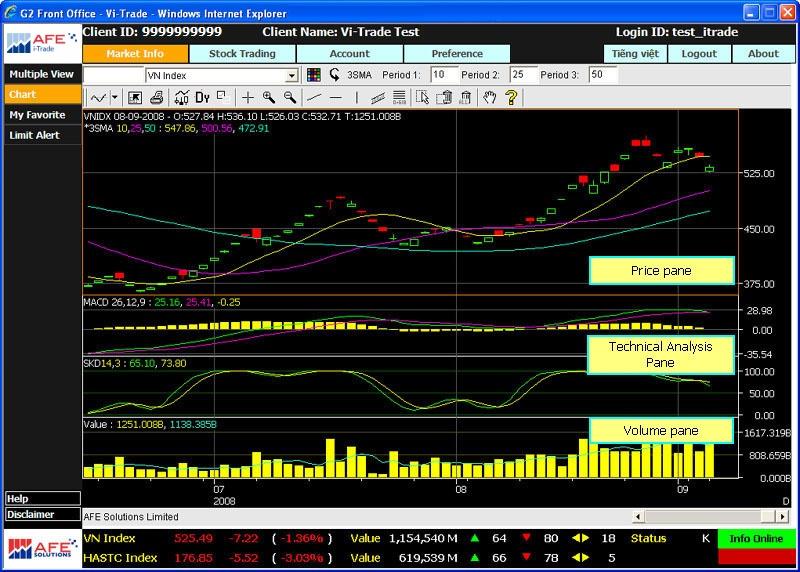
Select the TA to add. The selected TA will be added to a news TA pane beneath the Price pane if maximum number of TA panes is not reached (maximum 5 panes) Otherwise the oldest TA pane will be replaced with the new TA.
|
|

|
Setting. This function allows user to modify the system setting. This includes:
|
|
|
- Background and foreground color of the chart panes.
- X and Y-axis background and foreground colors.
- Color and Parameter settings for the Base Time Series and enable Technical Analysis.
|
|
|
|
|
|
-
To change any color, click on the color button to be changed and then select the color from the color palette.
-
To change setting of Technical Analysis, select the Analysis from the drop down list and make the change.
-
To restore default setting, click Restore default setting� button.
|
|

|
Print. Print the current chart. Click the button will display the drop down list.
|
|
|
|
|

|
Chart Mode. Price chart can be displayed in three types. Click the button will display the drop down list.
|
|
|
|
|
|
Select the chart type from the drop down list and the current chart will be changed immediately to reflect the selected chart type.
|
|

|
Chart Interval. Chart can support various time intervals. Click the button will display the drop down list.
|
|
|
|
|
|
Select the chart interval from the drop down menu. The application will request data from server.
|
|

|
Show/Hide Option. Click the button will display the drop down list.
|
|
|
|
|

|
Cursor Type. Click the button will display the drop down list.
|
|
|
|
|

|
Zoom In.
|
|
|
- Click Zoom In button to activate the zoom in function.
- Points the mouse to start zoom in point, and then drag it to desired end point.
- The selected range will be highlighted.
- Release the left mouse button and the new range will be displayed.
|
|
|
|
|

|
Zoom Out. The application will memorize each zoom in range. Just click the Zoom Out button once to go back to the previous zoom in range.
|
|

|
Trend Line. Drawing a trend line.
|
|
|
To draw a Trend Line, follow these steps:
- Click Trend Line button.
- Move the cursor to the start of the line to be drawn, press the left mouse button and drag to the end point of the line to be drawn.
- Release the left mouse button.
- The line will be drawn once the left mouse button is released.
|
|

|
Horizontal Line. Prepares the cursor for drawing a horizontal trend line.
|
|

|
Vertical Line. Prepares the cursor for drawing a vertical trend line.
|
|

|
Channel Line. Prepares the cursor for drawing channel/parallel trend lines. To enable/disable this function, simply click the Channel Line button.
|
|
|
To draw Channel/Parallel Line, follow these steps:
-
Click Channel Line button.
-
Move the mouse to the start of the first parallel line to be drawn, press the left mouse button, drag the cursor to the end point of the first parallel line to be drawn and release the left mouse button.
-
A line will be drawn connecting to the start and end points.
-
Move the mouse to the point where the second parallel is to be drawn. As user moves the mouse, the second parallel line will be drawn at the cursor position.
-
Click left mouse button when the desired point of second line is located.
-
The channel line will be drawn.
|
|

|
Retracement. Prepares the cursor for drawing horizontal Fibonacci Retracement.
|
|
|
Fibonacci Retracement lines are drawn by first drawing a straight line (normally a trend line), then a series of horizontal lines are drawn intersecting the trend line at the Fibonacci intervals of 0.0, 23.6, 50.0, 61.8 and 100%. The horizontal lines shows the support and resistance levels often occur at or new the Fibonacci Retracement levels.
To draw Fibonacci Retracement lines, follow these steps:
- Click Retracement button.
- First point the cursor at the first extreme point, say a through.
- Press left mouse button and drag the cursor to the second extreme point, say a peak.
- Then release the left mouse button.
- The retracement lines will be drawn.
|
|

|
Tool Selection. To select a trend line or a set of trend lines for deletion, use this function to select the trend line first.
|
|
|
To select drawing tool, follow these steps:
- Click Tool Selection button.
- Move mouse to a point.
- Press left mouse button, and then drag the mouse.
- A rectangle will be drawn, inside which the trend line will be selected.
- Release left mouse button, the selected trend line will be highlighted with small square at their vertexes.
After selection is made, click  Delete Selected button to remove the selected trend line. Delete Selected button to remove the selected trend line.
|
|

|
Delete Selected. Click this button to delete the selected Analysis/Trend Line.
|
|

|
Delete All. Click this button to delete all Technical Analysis and Trend Line.
|
|

|
Drag Chart. After a chart is zoomed in, user can drag the chart to left or right by choosing drag function (click Drag button).
|
|
|
To drag the chart, follow these steps:
- Click Drag Chart button.
- Position mouse inside the chart area.
- Press left mouse button and drag it to left/right.
|
|

|
Help.
|